
Welcome to The Coding College, your go-to resource for programming and data science! In this article, we’ll dive into the Normal Distribution, a cornerstone concept in statistics and data science, and show you how to work with it using Python’s NumPy library.
What is a Normal Distribution?
The Normal Distribution, also known as the Gaussian Distribution, is a symmetric, bell-shaped curve that describes the spread of data around the mean. It is defined by two parameters:
- Mean (μ): The center of the distribution.
- Standard Deviation (σ): Determines the spread of the data.
Key Characteristics:
- Most data points are close to the mean.
- About 68% of data lies within one standard deviation of the mean.
- About 95% of data lies within two standard deviations of the mean.
Why is Normal Distribution Important?
- Common in Nature: Many natural phenomena, like heights, weights, and test scores, follow a normal distribution.
- Foundation for Statistical Methods: Key statistical techniques, like hypothesis testing and confidence intervals, rely on this distribution.
- Simplifies Analysis: Central Limit Theorem states that, with a large enough sample size, the sampling distribution of the mean is approximately normal, even if the population distribution isn’t.
Normal Distribution Formula
The probability density function (PDF) of the normal distribution is:
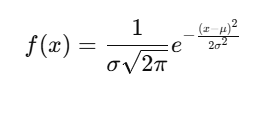
Where:
- x: Data point
- μ: Mean
- σ: Standard deviation
Generating Normal Distribution in NumPy
Python’s NumPy library provides functions to generate and analyze normal distributions efficiently.
1. Generating Random Data with numpy.random.normal()
The numpy.random.normal() function creates an array of random values following a normal distribution.
Syntax:
numpy.random.normal(loc=0.0, scale=1.0, size=None)loc: Mean of the distribution (default is 0).scale: Standard deviation of the distribution (default is 1).size: Output shape (default isNone, returns a single value).
Example 1: Generate Random Normal Data
import numpy as np

# Generate 10 random numbers with mean=0 and standard deviation=1
data = np.random.normal(loc=0, scale=1, size=10)
print(data)
Output (Example):
[-0.178 0.424 1.100 -0.121 -1.987 0.347 -0.228 0.886 0.155 -0.567]Example 2: Visualizing a Normal Distribution
import numpy as np
import matplotlib.pyplot as plt

# Generate 1000 random values
data = np.random.normal(loc=0, scale=1, size=1000)

# Plot histogram
plt.hist(data, bins=30, density=True, alpha=0.6, color='g')

# Plot theoretical PDF
mean, std_dev = 0, 1
x = np.linspace(-4, 4, 100)
pdf = (1 / (std_dev * np.sqrt(2 * np.pi))) * np.exp(-0.5 * ((x - mean) / std_dev) ** 2)
plt.plot(x, pdf, color='red', linewidth=2)
plt.title('Normal Distribution')
plt.xlabel('Value')
plt.ylabel('Density')
plt.show()
Example 3: Simulating Real-World Data
Generate heights of 1000 people with an average height of 170 cm and a standard deviation of 10 cm:
heights = np.random.normal(loc=170, scale=10, size=1000)
print(heights[:10])  # Print first 10 heights
Standard Normal Distribution
A Standard Normal Distribution is a special case where:
- Mean (μ) = 0
- Standard Deviation (σ) = 1
You can standardize any normal distribution by subtracting the mean and dividing by the standard deviation:
Formula:
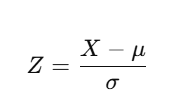
Example: Convert to Standard Normal Distribution
data = np.random.normal(loc=50, scale=10, size=10)
standardized = (data - np.mean(data)) / np.std(data)
print(standardized)
Applications of Normal Distribution
- Data Analysis: Many datasets in business, healthcare, and science follow a normal distribution.
- Machine Learning: Model assumptions and performance metrics often rely on normality.
- Finance: Stock returns are often modeled using normal distributions.
- Statistical Inference: Confidence intervals and hypothesis tests assume normality.
Summary
The Normal Distribution is a fundamental concept in statistics and data science, essential for understanding real-world data and performing meaningful analyses. Python’s NumPy library makes it easy to generate, visualize, and analyze normal distributions.