
Statistical variability, often referred to as the “spread” of data, measures how much the data points in a dataset differ from each other and from the central value. Understanding variability is crucial in statistical analysis, as it provides insight into the consistency, reliability, and distribution of data.
This guide will explore the core concepts of variability, its measures, and its importance in statistical and machine learning contexts.
What Is Statistical Variability?
Statistical variability quantifies the extent to which data points in a dataset differ or deviate from one another. A low variability indicates that the data points are close to each other and to the mean, while high variability suggests that the data points are spread out.
Key Measures of Variability
1. Range
The simplest measure of variability, representing the difference between the maximum and minimum values in the dataset.
Range=Maximum Value−Minimum Value
- Pros: Easy to calculate.
- Cons: Sensitive to outliers and does not account for data distribution.
2. Variance
Variance measures the average squared deviation of each data point from the mean. It provides a mathematical representation of how much the data varies.
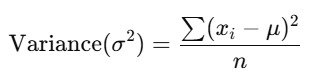
Where:
- xi: Individual data points.
- μ: Mean of the dataset.
- n: Total number of data points.
- High Variance: Indicates that the data points are widely spread.
- Low Variance: Indicates that the data points are closely clustered around the mean.
3. Standard Deviation
The standard deviation is the square root of the variance and provides a measure of variability in the same units as the data.
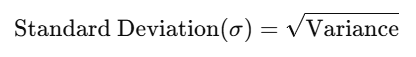
- Applications: Widely used in machine learning to measure data spread and in algorithms like feature scaling.
4. Interquartile Range (IQR)
IQR measures the spread of the middle 50% of the data, providing a robust metric that is less sensitive to outliers.
IQR=Q3−Q1
Where:
- Q3: Third quartile (75th percentile).
- Q1: First quartile (25th percentile).
- Use Case: Ideal for datasets with outliers or skewed distributions.
5. Mean Absolute Deviation (MAD)
MAD calculates the average of the absolute differences between each data point and the mean.
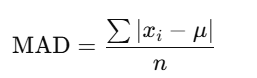
- Pros: Simple and interpretable.
- Cons: Less commonly used than variance or standard deviation.
Visualization of Variability
1. Box Plots
Box plots visually represent the IQR, median, and potential outliers.
2. Histograms
Histograms show the frequency distribution of data, highlighting its spread.
3. Scatter Plots
Scatter plots display the relationship between two variables and can indicate variability.
Variability in Machine Learning
Understanding variability is crucial for:
- Feature Engineering: Identifying features with significant variation.
- Data Preprocessing: Normalizing or standardizing data for consistent scale.
- Model Performance: Assessing the consistency and robustness of predictions.
Real-World Examples
- Finance: Measuring the volatility of stock prices.
- Healthcare: Analyzing variations in patient responses to treatments.
- E-commerce: Understanding customer purchase behavior across regions.
Example in Python
import numpy as np

# Example dataset
data = [10, 12, 15, 20, 25, 30]

# Calculating measures of variability
range_ = np.ptp(data)  # Range
variance = np.var(data)  # Variance
std_dev = np.std(data)  # Standard Deviation

print(f"Range: {range_}, Variance: {variance}, Standard Deviation: {std_dev}")