
Welcome to The Coding College, your go-to destination for mastering coding and programming. In this post, we will dive into the foundational role of statistics in Data Science. Statistics is a key tool that data scientists use to analyze, interpret, and visualize data, making it essential for building effective models and generating insights.
Understanding statistics will allow you to make better decisions based on data and ultimately drive better outcomes in fields like machine learning, business analytics, and artificial intelligence. Let’s explore the basics of statistics in the context of Data Science.
What is Statistics?
Statistics is the study of collecting, analyzing, interpreting, presenting, and organizing data. It involves various techniques to summarize data and draw meaningful conclusions. In Data Science, statistical methods are used to make sense of large amounts of data, uncover patterns, and make predictions.
Why Statistics is Crucial in Data Science
- Data Interpretation: Statistics helps data scientists understand the data they are working with. For example, using measures of central tendency (mean, median, mode) allows data scientists to summarize the data with a single value, making it easier to understand.
- Making Predictions: Through statistical methods like regression analysis, data scientists can predict future outcomes based on historical data, such as predicting customer behavior, sales, or stock prices.
- Statistical Inference: Using statistical inference, data scientists can make conclusions about a population based on a sample. This is crucial when working with large datasets where testing every data point isn’t feasible.
- Model Validation: In machine learning, statistics is used to validate models and ensure that the predictions made by algorithms are accurate and reliable.
- Data Visualization: Statistics also plays a role in presenting data visually. It helps data scientists create charts, histograms, and graphs that reveal trends and relationships in data.
Key Statistical Concepts in Data Science
To get started with statistics in data science, you need to understand some fundamental statistical concepts. Here’s an overview of the most important ones:
1. Measures of Central Tendency
These are statistics that describe the center of a data distribution.
- Mean: The average of all the data points.
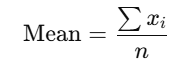
- Where xi are the data points, and n is the number of data points.
- Median: The middle value when the data points are arranged in order.
- Mode: The most frequent data point in the dataset.
2. Measures of Variability (Spread)
These are statistics that describe how spread out the data points are.
- Range: The difference between the largest and smallest values in the dataset.
- Variance: The average of the squared differences from the mean. It gives an idea of how spread out the data is.
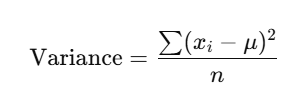
- Where xi are the data points, and n is the mean.
- Standard Deviation: The square root of the variance, which gives a more intuitive measure of data spread in the same unit as the original data.
3. Probability
In data science, probability helps us make predictions about the likelihood of future events based on past data. It forms the foundation of many statistical methods, including machine learning algorithms.
- Probability Distribution: A function that describes the likelihood of different outcomes in an experiment.
- Normal Distribution: A symmetric, bell-shaped distribution that is often used to represent real-world data. Many data science algorithms assume that the data is normally distributed.
4. Hypothesis Testing
Hypothesis testing is a statistical method used to make decisions based on data. It involves:
- Null Hypothesis (H₀): The hypothesis that there is no significant difference or effect.
- Alternative Hypothesis (H₁): The hypothesis that there is a significant difference or effect.
- p-value: A measure that helps determine whether the results of a statistical test are significant. A low p-value (typically less than 0.05) suggests strong evidence against the null hypothesis.
5. Correlation and Causation
Correlation measures the relationship between two variables. In Data Science, understanding correlation helps identify patterns in the data, but it is crucial to remember that correlation does not imply causation. Two variables may be correlated due to another underlying factor.
How to Use Statistics in Data Science
Now that we understand the key concepts, let’s explore how to apply statistics in real-world data science projects.
1. Data Exploration
Before applying advanced machine learning algorithms, data scientists first explore the data using statistical methods. This includes calculating summary statistics, visualizing distributions, and identifying outliers or anomalies in the data.
2. Model Building
In machine learning, statistical methods are used to build models. Linear regression, for instance, is a statistical method used to model the relationship between dependent and independent variables.
3. Model Evaluation
Once a model is built, statistics is used to evaluate its performance. For example, cross-validation and metrics like Mean Absolute Error (MAE), Root Mean Squared Error (RMSE), and R-squared are used to assess the model’s accuracy.
4. Predictive Analysis
Using statistical techniques like regression analysis, time series analysis, and Bayesian inference, data scientists make predictions about future events or trends based on historical data.
Python Libraries for Statistics in Data Science
Python is the most popular language in Data Science, and there are several libraries available for statistical analysis:
- NumPy: A powerful library for numerical computing, which includes functions for mean, variance, and standard deviation.
- Pandas: A data manipulation library that makes it easy to work with structured data and perform statistical calculations.
- SciPy: A library that includes statistical functions for hypothesis testing, probability distributions, and other advanced statistical methods.
- Statsmodels: A Python library that provides classes and functions for statistical modeling, including linear regression and hypothesis testing.
- Matplotlib and Seaborn: Libraries for data visualization, which can be used to plot statistical distributions and graphs.
Conclusion
Statistics is a foundational skill for data scientists. It enables professionals to understand data, build models, make predictions, and derive meaningful insights from datasets. At The Coding College, we strive to equip you with the tools and knowledge to succeed in data science, and mastering statistics is a critical first step in that journey.
Stay tuned for more tutorials and in-depth discussions on Data Science and Machine Learning. Don’t forget to explore our other resources and articles, all designed to help you enhance your programming skills.