
Welcome to The Coding College, your go-to resource for mastering data science and coding. In this post, we’ll explore linear regression, one of the most important and widely used techniques in data science. Linear regression helps us understand relationships between variables and make predictions. Whether you’re a beginner or an experienced practitioner, this post will break down the concept and show you how to use it in your data projects.
What is Linear Regression?
Linear regression is a statistical technique used to model the relationship between a dependent variable and one or more independent variables. The idea is to fit a straight line (or hyperplane in higher dimensions) to the data points in such a way that the line best represents the relationship between the variables. This line is often referred to as the regression line.
In its simplest form, linear regression is used when you have one independent variable (X) and one dependent variable (Y), which is known as simple linear regression.
The formula for simple linear regression is:
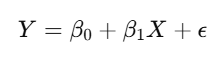
Where:
- Y is the dependent variable (the outcome you’re trying to predict),
- X is the independent variable (the predictor),
- β\beta_0 is the intercept (the value of Y when X is zero),
- β1beta_1 is the slope (the change in Y for a one-unit change in X),
- ϵ epsilon is the error term (representing the difference between the predicted and actual values).
Key Concepts in Linear Regression
Before diving into the practical applications, let’s understand the fundamental concepts of linear regression.
1. Intercept (β0\beta_0):
The intercept is the point where the regression line crosses the Y-axis. In real-world terms, it represents the value of the dependent variable when the independent variable is zero.
2. Slope (β1\beta_1):
The slope represents how much the dependent variable (Y) changes for a unit change in the independent variable (X). If the slope is positive, it means that as X increases, Y also increases. If the slope is negative, it means that as X increases, Y decreases.
3. Error Term (ϵ\epsilon):
The error term accounts for the differences between the observed and predicted values. In other words, it represents the residuals—the discrepancies that the regression model doesn’t account for.
4. R-squared (R2R^2):
R-squared is a measure of how well the independent variable explains the variation in the dependent variable. An R2R^2 value close to 1 means that the independent variable does a good job explaining the variation in the dependent variable, while an R2R^2 close to 0 means that the independent variable has little to no explanatory power.
Types of Linear Regression
1. Simple Linear Regression:
This involves one independent variable (X) and one dependent variable (Y). The goal is to find the best-fitting straight line that predicts the value of Y based on X.
2. Multiple Linear Regression:
When you have more than one independent variable (X₁, X₂, …, Xₖ), this is known as multiple linear regression. The formula becomes:
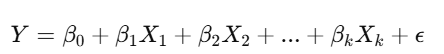
Multiple linear regression is useful when you want to understand the relationship between a dependent variable and several predictors.
Applications of Linear Regression
Linear regression is widely used in various fields. Here are a few common applications:
- Predicting Housing Prices: Predict the price of a house based on features like the number of rooms, location, size, and more.
- Sales Forecasting: Predict future sales based on historical data and other relevant factors.
- Risk Assessment: In finance, linear regression is used to assess the risk of investments based on various market factors.
- Marketing Analytics: Predict customer behavior, like the probability of purchase based on factors such as age, income, and online activity.
How to Perform Linear Regression in Python
Python, particularly with libraries like scikit-learn and statsmodels, provides a powerful environment for implementing linear regression.
Here’s a simple example using scikit-learn to perform simple linear regression:
# Importing necessary libraries
import numpy as np
import matplotlib.pyplot as plt
from sklearn.linear_model import LinearRegression

# Creating a simple dataset
X = np.array([[1], [2], [3], [4], [5]])  # Independent variable
Y = np.array([1, 2, 3, 4, 5])  # Dependent variable

# Initializing the Linear Regression model
model = LinearRegression()

# Fitting the model
model.fit(X, Y)

# Making predictions
Y_pred = model.predict(X)

# Plotting the data and the regression line
plt.scatter(X, Y, color='blue', label='Data points')
plt.plot(X, Y_pred, color='red', label='Regression line')
plt.title("Simple Linear Regression")
plt.xlabel("Independent Variable (X)")
plt.ylabel("Dependent Variable (Y)")
plt.legend()
plt.show()

# Outputting the slope and intercept
print(f"Slope: {model.coef_}")
print(f"Intercept: {model.intercept_}")
This code will plot the regression line and show the slope and intercept values.
Evaluating the Model
Once you’ve fit your linear regression model, it’s important to evaluate its performance. Here are some common ways to do that:
- Residuals Analysis: Plot the residuals (the differences between predicted and actual values) to check if the errors follow a random pattern. A random distribution of residuals suggests that the model is a good fit.
- R-squared: Use the R-squared value to understand how much of the variability in the dependent variable is explained by the independent variable(s).
- Mean Squared Error (MSE): This measures the average squared difference between actual and predicted values. A lower MSE indicates better model performance.
Limitations of Linear Regression
While linear regression is a powerful tool, it does have some limitations:
- Linearity: The relationship between the independent and dependent variables must be linear. If the relationship is non-linear, linear regression might not be suitable.
- Outliers: Linear regression is sensitive to outliers. A single outlier can disproportionately affect the slope and intercept of the regression line.
- Multicollinearity: In multiple linear regression, if independent variables are highly correlated with each other, it can cause multicollinearity, which makes the model coefficients unreliable.
Conclusion
Linear regression is a fundamental technique in data science for modeling relationships between variables and making predictions. Whether you’re working with a single predictor or multiple variables, linear regression provides valuable insights into how changes in one variable can influence another. Understanding the key concepts of linear regression will help you build better models and make informed decisions with your data.
At The Coding College, we are committed to providing practical knowledge and coding tutorials to help you master data science. Whether you’re just getting started or refining your skills, we aim to make complex topics easy to understand and apply.