
Welcome to The Coding College, your go-to resource for everything related to data science and statistical analysis. In this post, we will explore one of the most important metrics in regression analysis—the R-squared value. This metric is often found in a regression table and is used to assess how well the independent variables explain the variability of the dependent variable. Let’s dive into understanding R-squared and its role in evaluating the performance of a regression model.
What Is R-Squared in a Regression Table?
R-squared, often denoted as R², is a statistical measure that explains the proportion of the variance in the dependent variable that is explained by the independent variables in the model. It is also known as the coefficient of determination.
In a regression table, the R-squared value indicates how well the model fits the data. The closer the R-squared value is to 1, the better the model explains the variance in the dependent variable. If R-squared is closer to 0, the model does not explain much of the variability in the data.
Understanding R-Squared in a Regression Table
Let’s take a look at a typical regression table with the R-squared value included:
| Variable | Coefficient | Standard Error | t-Value | P-Value | R-Squared |
|---|---|---|---|---|---|
| Intercept | 20,000 | 4,000 | 5.00 | 0.000 | |
| Size (sq ft) | 150 | 40 | 3.75 | 0.002 | |
| Rooms (count) | 2,000 | 800 | 2.50 | 0.020 | |
| Location (Urban) | 8,000 | 3,500 | 2.29 | 0.031 | 0.85 |
Key Points to Note:
- R-Squared Value: In this regression table, the R-squared value of 0.85 indicates that the model explains 85% of the variability in the dependent variable (for example, house price in this case).
- Intercept and Coefficients: The R-squared value doesn’t tell us about the significance of individual coefficients, but it tells us how well the model fits the overall data.
- High R-Squared: An R-squared value of 0.85 means the model is able to explain a significant portion of the variance in the data. However, it doesn’t guarantee that the model is perfect. A high R-squared value can be misleading, especially in the presence of overfitting.
How to Interpret R-Squared
- R-Squared = 1: A perfect fit, meaning the model explains all the variability in the dependent variable.
- R-Squared = 0: The model does not explain any of the variability in the dependent variable, and the model is a poor fit.
- 0 < R-Squared < 1: A value between 0 and 1 indicates the proportion of the variance explained by the independent variables. The closer to 1, the better the model fits the data.
Example of Interpretation:
If you are building a regression model to predict the price of houses, and your model produces an R-squared value of 0.85, it means that 85% of the variation in the house prices can be explained by the independent variables in your model (e.g., size of the house, number of rooms, and location).
However, 15% of the variation in the prices remains unexplained by the model, which could be due to other factors not included in the model (such as neighborhood trends or market conditions).
Why R-Squared Is Important in Regression Analysis
R-squared is a key indicator of model performance. It helps you understand how well your regression model fits the data and how much variability it explains. A high R-squared value suggests that the model has a good fit and is able to predict the dependent variable effectively.
However, while a high R-squared value indicates a good model fit, it should not be the sole criterion for model selection. There are other important considerations to keep in mind:
- Overfitting: A model with too many predictors may have a high R-squared value but could be overfitting the data. Overfitting occurs when the model captures noise in the data, which may not generalize well to new data.
- Adjusted R-Squared: When you add more predictors to your model, the R-squared value will always increase, even if the added predictors are not helpful. Adjusted R-squared adjusts for the number of predictors in the model and is a better measure of the model’s goodness-of-fit when comparing models with different numbers of predictors.
R-Squared and Model Fit
1. Explained vs. Unexplained Variance
R-squared is calculated as:
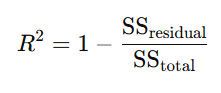
Where:
- SSresidual\text{SS}_{\text{residual}} is the sum of squared residuals (the unexplained variance).
- SStotal\text{SS}_{\text{total}} is the total sum of squared differences between the observed values and the mean of the dependent variable (the total variance).
2. Limitations of R-Squared
While R-squared is an important metric, it has its limitations:
- It doesn’t prove causality: A high R-squared value does not mean that the independent variables are causing the change in the dependent variable. It simply indicates that there is a relationship.
- It doesn’t account for the quality of the data: A high R-squared value doesn’t necessarily mean that the data is clean, and the model might still have outliers or other issues.
How to Improve R-Squared
To improve the R-squared value in your regression model:
- Add more relevant predictors: Including more variables that are logically related to the dependent variable can increase R-squared.
- Data transformation: Consider applying transformations like logarithms or polynomial terms to model complex relationships.
- Remove irrelevant predictors: If predictors are not relevant, they can dilute the model’s effectiveness, leading to a lower R-squared value.
Conclusion
R-squared is a crucial metric in regression analysis that helps evaluate the goodness-of-fit of your model. While a high R-squared value suggests a good model fit, it should not be the only criterion for selecting a model. Understanding its strengths and limitations, along with considering other metrics like adjusted R-squared and overfitting, will give you a more comprehensive understanding of your model’s performance.
At The Coding College, we strive to make complex data science concepts more accessible. Whether you’re a beginner or an advanced data scientist, understanding R-squared and its role in model evaluation will help you improve your regression models and make better data-driven decisions.