
Descriptive statistics is a branch of statistics focused on summarizing and organizing data to make it easier to interpret. This guide delves into its core concepts, techniques, and applications, providing a foundation for understanding how data can be described effectively in various contexts.
What Is Descriptive Statistics?
Descriptive statistics involves methods to:
- Summarize data: Provide key metrics that highlight the essential characteristics of the data.
- Visualize data: Represent data graphically for better understanding.
Unlike inferential statistics, which draws conclusions about populations from samples, descriptive statistics focuses solely on describing the sample data itself.
Key Components of Descriptive Statistics
1. Measures of Central Tendency
Central tendency describes the central point around which the data is distributed.
Mean (Average)
The arithmetic average of the data values.
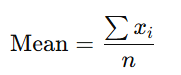
Where xix_i represents individual data points and nn is the total number of data points.
Median
The middle value when data is sorted in ascending order. If there is an even number of observations, the median is the average of the two middle values.
Mode
The most frequently occurring value in a dataset.
2. Measures of Dispersion
Dispersion indicates the spread of the data values.
Range
The difference between the maximum and minimum values in a dataset. Range=Maximum−Minimum
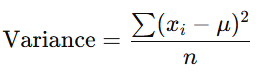
Variance
The average of the squared differences from the mean.
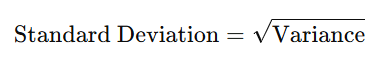
Standard Deviation
The square root of variance, showing how much data deviates from the mean.
Interquartile Range (IQR)
The range within which the central 50% of the data lies,
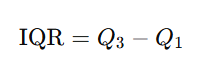
Where Q3Q_3 and Q1Q_1 are the third and first quartiles, respectively.
3. Data Distribution
Understanding the shape and spread of data helps identify patterns and outliers.
Skewness
Measures the asymmetry of the data distribution.
- Positive Skew: Tail on the right.
- Negative Skew: Tail on the left.
Kurtosis
Measures the “tailedness” of the distribution.
4. Data Visualization Techniques
Visualization is a crucial part of descriptive statistics, making it easier to interpret data.
Histograms
Show the frequency of data within specified intervals.
Box Plots
Highlight the distribution, central tendency, and outliers in the data.
Bar Graphs
Compare categories or groups.
Pie Charts
Show proportions or percentages in a dataset.
Scatter Plots
Depict relationships between two continuous variables.
Applications of Descriptive Statistics
- Business: Analyzing customer demographics and purchase patterns.
- Healthcare: Summarizing patient data to identify trends.
- Education: Evaluating test scores to understand student performance.
- Data Science: Cleaning and preprocessing data before building models.
Descriptive Statistics in Machine Learning
In machine learning, descriptive statistics is used for:
- Data Exploration: Understanding the dataset before model training.
- Feature Engineering: Identifying key features based on statistical summaries.
- Outlier Detection: Spotting anomalies that might skew model performance.
Tools for Descriptive Statistics
1. Python
- NumPy: For basic statistical functions.
- Pandas: For data manipulation and analysis.
- Matplotlib & Seaborn: For visualization.
2. R
R provides built-in functions and packages for statistical analysis and visualization.
Example in Python
Here’s a Python example demonstrating descriptive statistics:
import pandas as pd

# Sample dataset
data = {'Scores': [45, 50, 55, 60, 65, 70, 75]}
df = pd.DataFrame(data)

# Descriptive statistics
mean = df['Scores'].mean()
median = df['Scores'].median()
std_dev = df['Scores'].std()

print(f"Mean: {mean}, Median: {median}, Standard Deviation: {std_dev}")
Learning Resources
- Books:
- Statistics for Beginners by Deborah Rumsey.
- Practical Statistics for Data Scientists by Peter Bruce.
- Courses:
- Descriptive Statistics (Khan Academy).
- Statistics for Data Science (Coursera).