
Welcome to The Coding College, where we simplify data science and programming concepts! In this article, we’ll explore the Chi-Square Distribution, its properties, applications, and how to implement it in Python using NumPy.
What is the Chi-Square Distribution?
The Chi-Square Distribution is a continuous probability distribution widely used in hypothesis testing and inferential statistics, particularly for categorical data. It is defined as the distribution of a sum of squared independent standard normal variables.
Formula:
If Z1,Z2,…,Zk are independent standard normal variables, then:
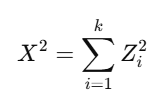
follows a Chi-Square Distribution with kk degrees of freedom (k).
Key Characteristics
- Degrees of Freedom (k): Determines the shape of the distribution.
- Positive Values Only: The distribution is defined only for x≥0x \geq 0.
- Mean: Equal to the degrees of freedom (k).
- Variance: 2k.
Real-Life Applications
- Hypothesis Testing: Chi-square tests for independence and goodness of fit.
- Confidence Intervals: Estimating population variances.
- Model Evaluation: Statistical tests for machine learning models.
Chi-Square Distribution in NumPy
Python’s NumPy library provides a function to generate random numbers from a Chi-Square distribution:
Syntax:
numpy.random.chisquare(df, size=None)df: Degrees of freedom (kk).size: Output shape (default isNone, which returns a single value).
Example 1: Generating Random Numbers
Scenario: Simulate a Chi-Square distribution with 4 degrees of freedom
import numpy as np

# Generate Chi-Square random numbers
data = np.random.chisquare(df=4, size=10)
print("Random samples from Chi-Square distribution:", data)
Output (Example):
[2.15 5.62 3.14 6.78 4.33 1.09 2.78 5.34 3.67 4.89]Example 2: Visualizing Chi-Square Distribution
import numpy as np
import matplotlib.pyplot as plt

# Generate data for different degrees of freedom
x1 = np.random.chisquare(df=2, size=1000)
x2 = np.random.chisquare(df=4, size=1000)
x3 = np.random.chisquare(df=6, size=1000)

# Plot histograms
plt.hist(x1, bins=30, alpha=0.5, label='df=2', color='blue', density=True)
plt.hist(x2, bins=30, alpha=0.5, label='df=4', color='orange', density=True)
plt.hist(x3, bins=30, alpha=0.5, label='df=6', color='green', density=True)

plt.title('Chi-Square Distributions')
plt.xlabel('Value')
plt.ylabel('Density')
plt.legend()
plt.grid(True)
plt.show()
Example 3: Goodness-of-Fit Test
Scenario: Checking if observed frequencies follow an expected distribution
from scipy.stats import chisquare

# Observed frequencies
observed = [18, 22, 20, 15, 25]

# Expected frequencies
expected = [20, 20, 20, 20, 20]

# Perform Chi-Square test
chi2, p = chisquare(f_obs=observed, f_exp=expected)

print(f"Chi-Square statistic: {chi2}")
print(f"P-value: {p}")

if p < 0.05:
    print("Reject the null hypothesis: Observed and expected distributions differ.")
else:
    print("Fail to reject the null hypothesis: Observed and expected distributions are similar.")
Example 4: Chi-Square Test for Independence
Scenario: Analyzing survey data for independence
import numpy as np
from scipy.stats import chi2_contingency

# Contingency table (survey data)
data = np.array([[50, 30], [20, 100]])

# Perform Chi-Square test for independence
chi2, p, dof, expected = chi2_contingency(data)

print(f"Chi-Square statistic: {chi2}")
print(f"P-value: {p}")
print(f"Degrees of freedom: {dof}")
print("Expected frequencies:")
print(expected)

if p < 0.05:
    print("Reject the null hypothesis: Variables are dependent.")
else:
    print("Fail to reject the null hypothesis: Variables are independent.")
Chi-Square Distribution Properties
| Property | Description |
|---|---|
| Shape | Positively skewed; becomes symmetric as kk increases. |
| Mean | Equal to kk. |
| Variance | Equal to 2k2k. |
| Applications | Used in hypothesis testing and confidence intervals. |
Chi-Square vs Other Distributions
| Aspect | Chi-Square | Normal | Exponential |
|---|---|---|---|
| Type | Continuous | Continuous | Continuous |
| Focus | Sum of squared normal variables | General symmetric data | Time between events |
| Applications | Hypothesis testing | Data analysis | Queueing models |
Summary
The Chi-Square Distribution is a cornerstone of statistical analysis and hypothesis testing. Its utility in evaluating categorical data and goodness-of-fit makes it indispensable for data scientists and statisticians.
With Python’s NumPy and SciPy, you can simulate, analyze, and apply the Chi-Square Distribution to solve real-world problems efficiently.
For more tutorials on statistics, Python, and data science, visit The Coding College.