
Welcome to The Coding College, your go-to platform for mastering coding and programming skills. In today’s post, we’ll be exploring two critical concepts in Data Science and Linear Regression: the Slope and the Intercept. These two elements are fundamental when modeling relationships between variables, and understanding them is key for building accurate predictive models. Let’s break down the concepts of slope and intercept, their importance, and how you can interpret them in data science.
What are Slope and Intercept?
In the context of linear equations and linear regression, the slope and intercept are the coefficients that define the line in a two-dimensional coordinate system. The general form of a linear equation is:
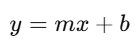
Where:
- y is the dependent variable (output),
- x is the independent variable (input),
- m is the slope, and
- b is the intercept.
Let’s take a closer look at each component:
1. The Slope (m)
The slope represents the rate of change between the dependent variable (yy) and the independent variable (xx). It tells you how much yy changes for each unit change in xx. Mathematically, the slope is defined as:
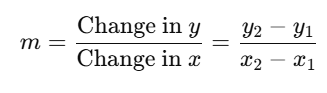
- If the slope is positive, the line rises from left to right (indicating a positive relationship).
- If the slope is negative, the line falls from left to right (indicating a negative relationship).
- If the slope is zero, the line is horizontal (indicating no relationship between the variables).
2. The Intercept (b)
The intercept is the point where the line crosses the y-axis. It represents the value of yy when x = 0. The intercept tells you the baseline value of the dependent variable when no independent variable is present. Mathematically, this can be interpreted as:
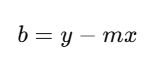
Where:
- m is the slope,
- x is the value of the independent variable,
- y is the value of the dependent variable at that point.
The intercept provides a starting point for the line and helps to position the line within the graph.
Importance of Slope and Intercept in Data Science
Understanding the slope and intercept is crucial in Data Science, especially when working with linear regression models. Linear regression is one of the most commonly used statistical techniques in data science and machine learning to model the relationship between a dependent variable and one or more independent variables.
Here’s why the slope and intercept matter:
- Prediction: The slope and intercept together define the regression line, which allows you to predict the value of the dependent variable given a new value for the independent variable.
- Model Interpretation: By understanding the slope, you can interpret how strongly the independent variable affects the dependent variable. A steeper slope indicates a stronger effect.
- Statistical Significance: In regression analysis, the significance of the slope can be tested to determine if the independent variable has a meaningful relationship with the dependent variable. A statistically significant slope suggests that changes in the independent variable do indeed affect the dependent variable.
- Understanding Trends: The intercept tells you where the trend starts. For instance, in a business scenario, the intercept might represent the baseline revenue when no advertising (independent variable) has been done.
How to Calculate Slope and Intercept
Let’s take a practical example of calculating the slope and intercept using Python. We will use the scikit-learn library, which makes fitting a linear regression model simple.
Example: Calculating Slope and Intercept Using Python
import numpy as np
from sklearn.linear_model import LinearRegression
import matplotlib.pyplot as plt

# Example dataset: Years of Experience vs Salary
X = np.array([1, 2, 3, 4, 5, 6, 7, 8, 9, 10]).reshape(-1, 1)  # Experience (independent variable)
y = np.array([40000, 45000, 50000, 55000, 60000, 65000, 70000, 75000, 80000, 85000])  # Salary (dependent variable)

# Initialize the Linear Regression model
model = LinearRegression()

# Fit the model to the data
model.fit(X, y)

# Get the slope and intercept
slope = model.coef_[0]
intercept = model.intercept_

print(f"Slope: {slope}")
print(f"Intercept: {intercept}")

# Predict salary for a person with 6 years of experience
predicted_salary = model.predict([[6]])

print(f"Predicted salary for 6 years of experience: {predicted_salary[0]}")

# Plotting the data and the regression line
plt.scatter(X, y, color='blue', label='Data points')  # Data points
plt.plot(X, model.predict(X), color='red', label=f'Regression Line: y = {slope:.2f}x + {intercept:.2f}')
plt.xlabel('Years of Experience')
plt.ylabel('Salary')
plt.title('Linear Regression: Salary vs Experience')
plt.legend()
plt.show()
In this example:
- We use NumPy to create an array of experience and salary values.
- We use scikit-learn’s LinearRegression model to fit the data and calculate the slope and intercept.
- We then visualize the data points along with the regression line to see how well the model fits the data.
Practical Use Cases of Slope and Intercept
- Real Estate: Predicting house prices based on features such as square footage, number of rooms, etc. The slope would represent the change in price for each unit increase in a feature, and the intercept would represent the baseline price.
- Finance: In predicting stock prices, the slope could represent the rate of change in the price over time, and the intercept could be the stock price at the starting point (time = 0).
- Healthcare: In a study of how exercise affects weight loss, the slope might represent the change in weight for each hour spent exercising, while the intercept would represent the weight of an individual before starting any exercise.
Conclusion
The slope and intercept are foundational elements of linear regression and essential concepts in Data Science. Understanding how to calculate and interpret them enables data scientists to build effective predictive models, analyze trends, and make informed decisions based on data. With the help of Python and libraries like scikit-learn, you can easily implement and visualize linear models to solve real-world problems.
At The Coding College, we are committed to providing high-quality resources to help you master Data Science concepts. Stay tuned for more tutorials on regression models, statistical analysis, and machine learning techniques.