
Welcome to The Coding College, your go-to resource for learning coding and data science. In this tutorial, we’ll explore correlation—a crucial concept in statistics and data science. Correlation helps in understanding the relationship between two or more variables, which is an essential step in data analysis and building predictive models.
Let’s dive into the concept of correlation, its significance in data science, how to calculate it, and how it is applied in real-world scenarios.
What is Correlation?
In statistics, correlation refers to the statistical relationship or association between two or more variables. It measures the strength and direction of this relationship. A high positive correlation means that as one variable increases, the other tends to increase as well, whereas a high negative correlation means that as one variable increases, the other decreases.
Correlation is typically measured using the correlation coefficient.
Types of Correlation
- Positive Correlation: If one variable increases as the other increases, the correlation is positive. For example, the more hours you study, the higher your test score tends to be.
- Negative Correlation: If one variable decreases as the other increases, the correlation is negative. For example, the more time you spend on social media, the lower your productivity might be.
- Zero or No Correlation: If there’s no predictable relationship between the variables, the correlation is zero. For instance, there may be no correlation between the number of pets you have and your favorite color.
The Correlation Coefficient
The correlation coefficient is a value between -1 and 1 that quantifies the degree of correlation between two variables.
- +1: Perfect positive correlation (variables increase together).
- -1: Perfect negative correlation (one variable increases while the other decreases).
- 0: No correlation (variables do not affect each other).
Formula for Correlation Coefficient
The formula for calculating the correlation coefficient, often represented as r, is:
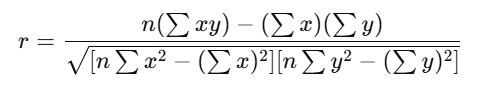
Where:
- n is the number of data points,
- x and yy are the two variables being compared,
- ∑xy is the sum of the product of corresponding values of xx and yy,
- ∑x2 and ∑y2 are the sums of the squares of xx and yy, respectively.
Why is Correlation Important in Data Science?
In data science, correlation is vital for several reasons:
- Identifying Relationships: Correlation helps identify relationships between variables, which can be useful in building machine learning models. For instance, if you know two variables are highly correlated, you can make better predictions or simplify the model by reducing variables.
- Feature Engineering: In machine learning, features that are highly correlated with the target variable are considered more valuable for predictive modeling.
- Data Cleaning: Correlation is used to detect redundant variables that are highly correlated with each other. Redundant features can often be removed to avoid overfitting.
- Business Insights: Correlation analysis can uncover valuable insights in business, such as understanding how different factors influence sales, customer behavior, or product performance.
How to Calculate Correlation in Python
Now, let’s go through a simple example of calculating the correlation coefficient using Python and the NumPy library.
Example Dataset:
Data 1 (X)=[2,3,5,7,9]
Data 2 (Y)=[1,4,6,8,10]
Step 1: Import Libraries
import numpy as npStep 2: Define the Data
# Example data
x = np.array([2, 3, 5, 7, 9])
y = np.array([1, 4, 6, 8, 10])
Step 3: Calculate the Correlation Coefficient
# Calculate the correlation coefficient
correlation = np.corrcoef(x, y)[0, 1]
print(f"Correlation Coefficient: {correlation}")
Output:
Correlation Coefficient: 0.998In this case, the correlation coefficient is 0.998, indicating a very strong positive correlation between x and y.
Visualizing Correlation
To better understand the relationship between two variables, we can visualize the correlation using a scatter plot. If the points on the plot form a straight line, the correlation is either positive or negative.
Here’s how to visualize the correlation in Python using Matplotlib:
import matplotlib.pyplot as plt

# Scatter plot to visualize correlation
plt.scatter(x, y)
plt.title('Scatter Plot of X vs Y')
plt.xlabel('X')
plt.ylabel('Y')
plt.show()
Practical Applications of Correlation
Here are some real-world applications of correlation in data science:
- Predictive Modeling: In predictive models, correlation analysis can help identify which variables are most predictive of the outcome variable.
- Stock Market Analysis: Correlation is widely used in finance to analyze the relationship between different stock prices or economic indicators.
- Healthcare: In healthcare, correlation analysis helps determine the relationship between variables like age, blood pressure, and cholesterol levels to predict health risks.
- Marketing: Correlation helps marketers understand the relationship between marketing spend and customer behavior, such as purchase decisions.
Conclusion
Understanding correlation is crucial for analyzing data and building effective machine learning models in data science. By measuring the relationship between variables, correlation allows you to make more informed decisions, perform feature engineering, and detect potential patterns in your data.
At The Coding College, we are committed to providing you with the knowledge and tools needed to excel in data science and coding. Stay tuned for more tutorials on key concepts, coding techniques, and industry applications in data science.