
Welcome to The Coding College, your go-to source for all things coding and programming. In this post, we’ll dive into percentiles—a key concept in statistics and data science. Percentiles are widely used to understand the distribution of data, compare datasets, and draw meaningful conclusions. Whether you’re working on predictive modeling, data analysis, or data visualization, understanding percentiles is crucial for making informed decisions.
Let’s explore percentiles, how they’re calculated, and their significance in data science.
What Are Percentiles?
In statistics, a percentile is a value below which a given percentage of observations in a dataset fall. Percentiles are useful for understanding the distribution of data by dividing it into 100 equal parts, with each part representing 1% of the dataset.
For example:
- The 25th percentile is the value below which 25% of the data points fall.
- The 50th percentile is the median, the value below which 50% of the data points fall.
- The 75th percentile is the value below which 75% of the data points fall.
Percentiles help provide a clearer picture of how data points are distributed, especially when dealing with large datasets or when you need to summarize data without relying solely on the mean.
Why Percentiles Are Important in Data Science
Percentiles are particularly useful in data science for several reasons:
- Understanding Data Distribution: Percentiles provide a more robust view of data distribution than just looking at averages. They help identify where data points are concentrated and where extreme values (outliers) might be present.
- Identifying Outliers: Extreme percentiles (like the 1st or 99th percentiles) can be used to identify outliers or anomalies in data. By focusing on these extremes, you can detect unusual data points that might skew analysis or model results.
- Comparing Data: Percentiles allow for easy comparison between different datasets, even if the datasets have different scales or distributions. For instance, comparing the performance of students in different schools can be done using percentiles, which normalizes the data.
- Risk Analysis: In business and finance, percentiles are often used in risk analysis. For example, a company might look at the 90th percentile of sales data to assess high-performing periods or the 10th percentile to identify periods of low performance.
How to Calculate Percentiles
To calculate the p-th percentile of a dataset, follow these steps:
- Sort the Data: Arrange the data points in ascending order.
- Find the Rank: The rank RR of the p-th percentile is given by the formula:
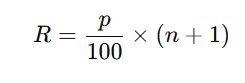
- Where:
- p is the desired percentile (e.g., 25 for the 25th percentile),
- n is the total number of data points.
- Interpolate: If R is not an integer, interpolate between the two closest data points to find the exact percentile value.
Let’s look at a practical example.
Example: Finding the 25th and 75th Percentiles
Suppose we have the following dataset:
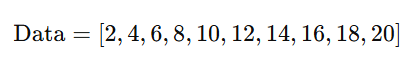
- Sort the Data (Already sorted in this case).
- Calculate the Rank for the 25th Percentile:
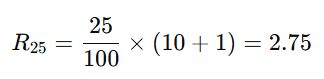
- Since 2.75 is not an integer, we interpolate between the 2nd and 3rd values:
- The 2nd value is 4.The 3rd value is 6.
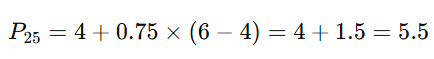
- Therefore, the 25th percentile is 5.5.
- Calculate the Rank for the 75th Percentile:
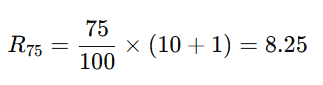
- Since 8.25 is not an integer, we interpolate between the 8th and 9th values:
- The 8th value is 16.The 9th value is 18.
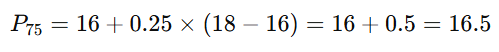
- Therefore, the 75th percentile is 16.5.
Using Percentiles in Python
Let’s take a look at how to calculate percentiles using Python and the NumPy library.
import numpy as np

# Example dataset
data = np.array([2, 4, 6, 8, 10, 12, 14, 16, 18, 20])

# Calculate the 25th and 75th percentiles
percentile_25 = np.percentile(data, 25)
percentile_75 = np.percentile(data, 75)

print(f"25th Percentile: {percentile_25}")
print(f"75th Percentile: {percentile_75}")
Practical Applications of Percentiles
Percentiles have broad applications in various domains, such as:
- Education: Evaluating students’ performance in exams and identifying top-performing students (e.g., the top 10% of students).
- Healthcare: Analyzing patient data, such as identifying the 95th percentile of cholesterol levels to detect abnormal health conditions.
- Finance: Percentiles are used in risk management to analyze financial data. For example, the 90th percentile of stock returns might be used to assess high-performing investments.
- Retail: Companies often analyze sales data using percentiles to understand customer behavior and assess which products fall into the highest-performing categories.
Visualizing Percentiles
To better understand how percentiles work, visualizing the data distribution can be helpful. You can use histograms or box plots to show percentiles effectively.
Example: Visualizing Percentiles with Python
import matplotlib.pyplot as plt

# Data for visualization
data = np.array([2, 4, 6, 8, 10, 12, 14, 16, 18, 20])

# Plot histogram
plt.hist(data, bins=5, edgecolor='black', alpha=0.7)
plt.axvline(np.percentile(data, 25), color='r', linestyle='dashed', label='25th Percentile')
plt.axvline(np.percentile(data, 75), color='g', linestyle='dashed', label='75th Percentile')
plt.legend()
plt.title('Histogram with Percentiles')
plt.xlabel('Data Points')
plt.ylabel('Frequency')
plt.show()
Conclusion
Percentiles are a powerful tool in Data Science for analyzing data distributions, identifying outliers, and making data-driven decisions. Whether you’re working with financial data, healthcare metrics, or machine learning models, percentiles help you understand the underlying trends and behaviors in your datasets.
At The Coding College, we provide high-quality resources to help you deepen your understanding of Data Science concepts. By mastering percentiles and other statistical methods, you can enhance your analytical skills and contribute to data-driven decision-making processes.