
Welcome to The Coding College, your ultimate resource for everything related to coding and programming. In this post, we’ll explore the concept of standard deviation—a fundamental statistical measure widely used in data science. Whether you’re working on data analysis, machine learning, or statistical modeling, understanding standard deviation is crucial for interpreting data variability and making accurate predictions.
Let’s delve into standard deviation, its significance, and how it is calculated and used in data science.
What is Standard Deviation?
In statistics, the standard deviation is a measure of the amount of variation or dispersion in a dataset. It quantifies the average distance of each data point from the mean (average) of the dataset. A low standard deviation means the data points are close to the mean, while a high standard deviation indicates that the data points are spread out over a wider range of values.
Mathematically, standard deviation is the square root of the variance. It is denoted by the symbol σ (for population standard deviation) or s (for sample standard deviation).
Formula for Standard Deviation
- Population Standard Deviation:
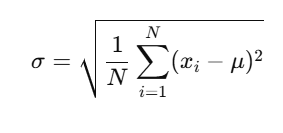
Where:
- σsigma is the population standard deviation,
- N is the total number of data points,
- xi is each individual data point,
- μmu is the mean of the dataset.
- Sample Standard Deviation:
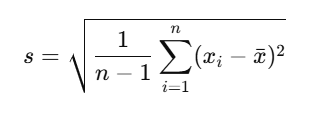
Where:
- s is the sample standard deviation,
- n is the sample size,
- xi is each individual data point,
- xˉbar{x} is the sample mean.
Why Standard Deviation is Important in Data Science
Standard deviation plays a pivotal role in data science for several reasons:
- Understanding Data Dispersion: Standard deviation helps you understand how data points are spread around the mean. This is essential when analyzing datasets to determine whether the data is concentrated or dispersed.
- Identifying Outliers: In many data science applications, outliers (values that are significantly higher or lower than most of the data) are critical. A high standard deviation indicates the presence of outliers, whereas a low standard deviation suggests that most data points are clustered near the mean.
- Risk Assessment: In fields like finance, standard deviation is often used to assess the risk of investment portfolios. A higher standard deviation in returns implies greater risk.
- Machine Learning Models: Many machine learning algorithms, such as regression models or clustering, assume a certain level of data consistency. Understanding the standard deviation helps in preparing data and choosing the right algorithms.
How to Calculate Standard Deviation
Let’s walk through how to calculate standard deviation step-by-step using a simple example.
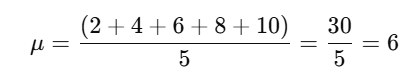
Example Dataset:
Data=[2,4,6,8,10]
Step 1: Find the Mean
First, calculate the mean (average) of the dataset.
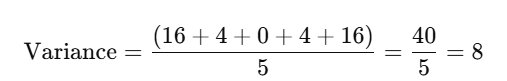
Step 2: Find the Squared Differences from the Mean
Next, subtract the mean from each data point and square the result:
(2−6)2=16 (4−6)2=4(4 – 6)^2 = 4(4−6)2=4 (6−6)2=0(6 – 6)^2 = 0(6−6)2=0 (8−6)2=4(8 – 6)^2 = 4(8−6)2=4 (10−6)2=16(10 – 6)^2 = 16(10−6)2=16
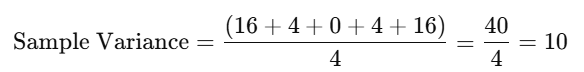
Step 3: Find the Average of the Squared Differences
Now, calculate the average of the squared differences. For a population, divide by the total number of data points (N=5N = 5):
For a sample, divide by the number of data points minus one (n=5−1=4n = 5 – 1 = 4):
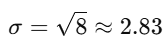
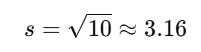
Step 4: Find the Square Root of the Variance
Finally, take the square root of the variance to find the standard deviation.
- Population Standard Deviation:
- Sample Standard Deviation:
Using Standard Deviation in Python
Let’s see how to calculate standard deviation using Python and the NumPy library.
import numpy as np

# Example dataset
data = np.array([2, 4, 6, 8, 10])

# Calculate the population standard deviation
population_std = np.std(data)

# Calculate the sample standard deviation
sample_std = np.std(data, ddof=1)

print(f"Population Standard Deviation: {population_std}")
print(f"Sample Standard Deviation: {sample_std}")
Visualizing Standard Deviation
Visualizing standard deviation is useful to understand data variability. A common way to visualize it is through a bell curve or normal distribution plot.
Example: Visualizing Data Distribution with Standard Deviation
import matplotlib.pyplot as plt

# Data for visualization
data = np.array([2, 4, 6, 8, 10])

# Plot histogram
plt.hist(data, bins=5, edgecolor='black', alpha=0.7)
plt.axvline(np.mean(data), color='r', linestyle='dashed', label='Mean')
plt.axvline(np.mean(data) + np.std(data), color='g', linestyle='dashed', label='1 Standard Deviation')
plt.axvline(np.mean(data) - np.std(data), color='g', linestyle='dashed')
plt.legend()
plt.title('Histogram with Standard Deviation')
plt.xlabel('Data Points')
plt.ylabel('Frequency')
plt.show()
Practical Applications of Standard Deviation
Standard deviation has several practical uses in data science, such as:
- Quality Control: In manufacturing, standard deviation can help measure the consistency of production.
- Finance: Investment risk can be assessed using the standard deviation of returns.
- Machine Learning: Standard deviation is used to assess the spread of features and normalize data, which is critical in training accurate models.
- Healthcare: Standard deviation can help measure the variation in patient outcomes, providing valuable insights into the consistency of treatments or diagnoses.
Conclusion
Standard deviation is an essential concept in data science and statistics. It helps to quantify the spread or variability of data, making it an invaluable tool for analyzing datasets, detecting outliers, and understanding patterns. Whether you’re working in finance, healthcare, or machine learning, mastering standard deviation will enhance your ability to make data-driven decisions.
At The Coding College, we provide in-depth tutorials and examples to help you understand key concepts like standard deviation. With this knowledge, you can enhance your data analysis skills and gain a deeper understanding of your datasets.