
Welcome to The Coding College, where we provide comprehensive tutorials and resources to help you master coding and programming. In this post, we will dive into the concept of variance—a fundamental statistical measure that is essential in the field of data science. Understanding variance is crucial for analyzing data, making predictions, and building machine learning models.
Let’s explore variance, its significance in data science, and how you can calculate and apply it in your data analysis tasks.
What is Variance?
In statistics, variance measures the degree of variation or dispersion of a dataset. It quantifies how far each data point in the set is from the mean (average) of the data. The greater the variance, the more spread out the data points are; the smaller the variance, the more tightly the data points are clustered around the mean.
Variance is typically used to understand the variability in a dataset. It is the average of the squared differences from the mean.
Formula for Variance
- Population Variance:
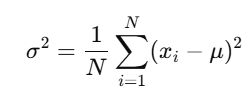
Where:
- σ2 is the population variance,
- N is the total number of data points,
- xi is each individual data point,
- μmu is the mean of the dataset.
- Sample Variance:
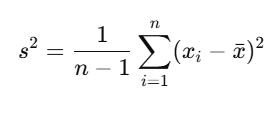
Where:
- s2 is the sample variance,
- n is the sample size,
- xi is each individual data point,
- xˉ is the sample mean.
Why Variance is Important in Data Science
Variance is crucial in data science for several reasons:
- Understanding Data Spread: Variance provides insight into how data points are distributed around the mean. It helps identify whether data is clustered closely around the mean or if there’s significant variation.
- Risk Assessment: In finance and business, variance is used to assess risk. A high variance indicates a volatile or risky environment, while a low variance indicates stability.
- Feature Selection: In machine learning, variance can be used to identify which features (variables) have the most impact on predictions. Features with low variance are often less informative.
- Model Evaluation: Variance is useful when evaluating the performance of machine learning models. It can highlight if the model is underfitting or overfitting the data.
How to Calculate Variance
Let’s go through a simple example to understand how to calculate variance step-by-step.
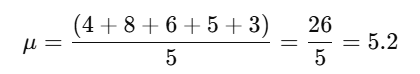
Example Dataset:
Data=[4,8,6,5,3]
Step 1: Find the Mean
First, calculate the mean (average) of the dataset.
Step 2: Find the Squared Differences from the Mean
Next, subtract the mean from each data point and square the result:
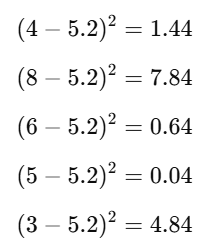
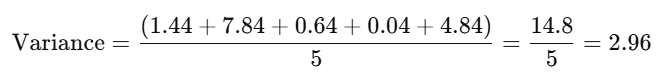
Step 3: Find the Average of the Squared Differences
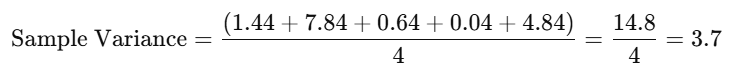
Now, calculate the average of the squared differences. For a population, divide by the total number of data points (N=5):
For a sample, divide by the number of data points minus one (n=5−1=4):
Using Variance in Python
To calculate variance easily, we can use Python with the NumPy library. Here’s an example:
import numpy as np

# Example dataset
data = np.array([4, 8, 6, 5, 3])

# Calculate the population variance
population_variance = np.var(data)

# Calculate the sample variance
sample_variance = np.var(data, ddof=1)

print(f"Population Variance: {population_variance}")
print(f"Sample Variance: {sample_variance}")
Visualizing Variance
A great way to visualize variance is by plotting the distribution of your data. A dataset with a high variance will have a wider spread, while a dataset with low variance will appear more concentrated around the mean.
Here’s an example of how to visualize the data distribution using a histogram:
import matplotlib.pyplot as plt

# Data for visualization
data = np.array([4, 8, 6, 5, 3])

# Plot histogram
plt.hist(data, bins=5, edgecolor='black', alpha=0.7)
plt.axvline(np.mean(data), color='r', linestyle='dashed', label='Mean')
plt.axvline(np.mean(data) + np.std(data), color='g', linestyle='dashed', label='1 Standard Deviation')
plt.axvline(np.mean(data) - np.std(data), color='g', linestyle='dashed')
plt.legend()
plt.title('Histogram with Variance')
plt.xlabel('Data Points')
plt.ylabel('Frequency')
plt.show()
Practical Applications of Variance
Here are a few real-world applications where variance is commonly used in data science:
- Risk Management: Variance helps assess risk in investment portfolios. A higher variance in stock returns indicates more risk.
- Quality Control: In manufacturing, variance is used to determine the consistency of production quality.
- Machine Learning: Variance is used in feature selection to identify which features contribute the most to predictions.
- Business Analysis: Variance helps businesses identify trends and anomalies in data, enabling more informed decision-making.
Conclusion
Variance is a key statistical measure in data science that helps you understand how data is spread around the mean. It is widely used in data analysis, risk management, machine learning, and quality control. By mastering variance and its calculation, you’ll be better equipped to analyze and interpret data, build effective models, and make informed decisions.
At The Coding College, we strive to provide you with the best resources to enhance your data science knowledge. Understanding variance is just one step toward becoming proficient in analyzing and working with data. Stay tuned for more tutorials, tips, and insights into the world of coding and data science.