
Understanding the performance of a classification model is crucial in Machine Learning. The Confusion Matrix is a powerful tool that provides a comprehensive summary of your model’s predictions and their accuracy.
In this tutorial on The Coding College, we’ll dive into what a Confusion Matrix is, its components, and how to implement it using Python.
What Is a Confusion Matrix?
A Confusion Matrix is a table used to evaluate the performance of a classification model by comparing actual labels to predicted labels.
Structure of a Confusion Matrix
For a binary classification problem, the Confusion Matrix looks like this:
| Predicted: Yes | Predicted: No | |
|---|---|---|
| Actual: Yes | True Positive (TP) | False Negative (FN) |
| Actual: No | False Positive (FP) | True Negative (TN) |
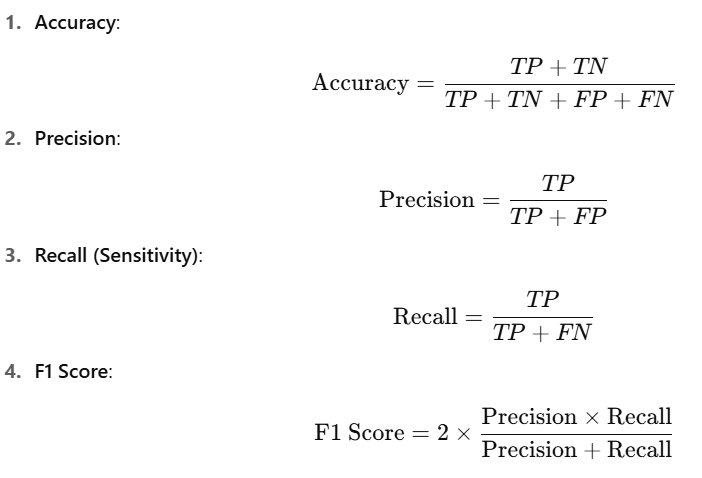
Key Metrics from the Matrix
Why Use a Confusion Matrix?
- Detailed Evaluation: Gives insights beyond just accuracy.
- Imbalanced Data: Useful for datasets with skewed class distributions.
- Performance Analysis: Highlights where the model makes errors (e.g., false positives or false negatives).
Implementing a Confusion Matrix in Python
Example Dataset
Let’s use the Iris dataset and build a simple classifier to generate a Confusion Matrix.
from sklearn.datasets import load_iris
from sklearn.model_selection import train_test_split
from sklearn.ensemble import RandomForestClassifier
from sklearn.metrics import confusion_matrix, ConfusionMatrixDisplay, classification_report

# Load the dataset
iris = load_iris()
X = iris.data
y = iris.target

# Split the dataset
X_train, X_test, y_train, y_test = train_test_split(X, y, test_size=0.3, random_state=42)

# Train a Random Forest Classifier
model = RandomForestClassifier(random_state=42)
model.fit(X_train, y_train)

# Make predictions
y_pred = model.predict(X_test)
Generating the Confusion Matrix
# Generate Confusion Matrix
cm = confusion_matrix(y_test, y_pred)

# Display Confusion Matrix
disp = ConfusionMatrixDisplay(confusion_matrix=cm, display_labels=iris.target_names)
disp.plot(cmap="Blues")
This generates a clear visual representation of the confusion matrix.
Evaluating Model Performance
Using metrics like precision, recall, and F1-score:
# Classification Report
report = classification_report(y_test, y_pred, target_names=iris.target_names)
print(report)
The classification report includes all the metrics derived from the Confusion Matrix.
Multi-Class Confusion Matrix
For datasets with multiple classes, the Confusion Matrix expands to accommodate all combinations of true and predicted classes.
For example:
| Predicted: Class A | Predicted: Class B | Predicted: Class C | |
|---|---|---|---|
| Actual: Class A | TP | FP | FP |
| Actual: Class B | FN | TP | FP |
| Actual: Class C | FN | FN | TP |
Common Challenges
- Class Imbalance: High accuracy may be misleading if one class dominates. Use precision, recall, or F1-score for better evaluation.
- Threshold Selection: For probabilistic classifiers, setting an appropriate decision threshold impacts the matrix values.
Exercises
Exercise 1: Generate a Confusion Matrix
Use the Breast Cancer dataset from Scikit-Learn and train a Logistic Regression model. Generate and visualize its Confusion Matrix.
Exercise 2: Evaluate a Classifier
Train a Support Vector Machine (SVM) classifier on the MNIST dataset. Use precision, recall, and F1-score to evaluate its performance.
Exercise 3: Adjust Threshold
Experiment with different decision thresholds for a probabilistic classifier (e.g., Logistic Regression) and observe the changes in the Confusion Matrix.
Why Learn at The Coding College?
At The Coding College, we focus on simplifying complex concepts like the Confusion Matrix to make them easy to understand and apply. Our tutorials guide you from basics to advanced topics in Machine Learning.
Conclusion
The Confusion Matrix is a vital tool for evaluating classification models. By mastering it, you gain a deeper understanding of your model’s performance and can make informed decisions to improve it.