
Welcome to The Coding College! In the journey of mastering Machine Learning, grasping statistical concepts like Percentiles is vital. Percentiles are widely used to understand data distributions, identify outliers, and preprocess datasets for effective modeling.
What Are Percentiles?
A percentile is a value below which a certain percentage of data points in a dataset fall.
Key Insights:
- 50th Percentile (Median): Splits the dataset into two equal halves.
- 90th Percentile: 90% of the data points lie below this value.
- 10th Percentile: 10% of the data points lie below this value.
Percentiles provide a clear picture of data spread and help identify values at specific thresholds.
Formula for Percentiles
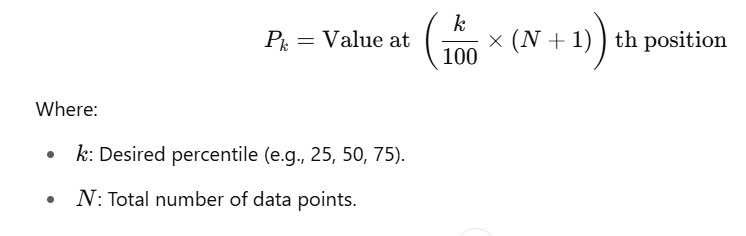
To calculate the kk-th percentile:
- Sort the dataset in ascending order.
- Use the formula:
Why Are Percentiles Important in Machine Learning?
- Understanding Data Distribution: Identify how data is spread across different ranges.
- Outlier Detection: Use percentiles to flag extreme values (e.g., values below the 5th or above the 95th percentile).
- Feature Engineering: Create meaningful features based on percentile thresholds.
- Model Evaluation: Assess performance metrics like percentiles in residuals or errors.
Calculating Percentiles in Python
Here’s how to calculate percentiles for a dataset:
Example Dataset
data = [5, 10, 15, 20, 25, 30, 35]1. Using Manual Calculation
Steps:
- Sort the Data:
[5, 10, 15, 20, 25, 30, 35] - Calculate Percentile Position: For the 25th percentile:
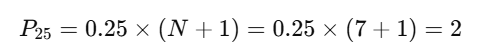
- The value at position 2 is 10.
2. Using Python Libraries
NumPy
import numpy as np

# 25th, 50th, and 75th percentiles
percentiles = np.percentile(data, [25, 50, 75])
print(f"25th: {percentiles[0]}, 50th: {percentiles[1]}, 75th: {percentiles[2]}")
Output:
25th: 12.5, 50th: 20.0, 75th: 27.5Pandas
import pandas as pd

data_series = pd.Series(data)
percentile_25 = data_series.quantile(0.25)
percentile_50 = data_series.quantile(0.50)
percentile_75 = data_series.quantile(0.75)

print(f"25th: {percentile_25}, 50th: {percentile_50}, 75th: {percentile_75}")
Both methods yield accurate results efficiently.
Practical Applications in Machine Learning
1. Outlier Detection
Flag values outside a specific percentile range (e.g., below the 5th or above the 95th percentile).
lower_bound = np.percentile(data, 5)
upper_bound = np.percentile(data, 95)

outliers = [x for x in data if x < lower_bound or x > upper_bound]
print(f"Outliers: {outliers}")
2. Feature Binning
Use percentiles to divide data into bins for feature engineering.
bins = np.percentile(data, [0, 25, 50, 75, 100])
data_bins = pd.cut(data, bins, labels=["Low", "Medium", "High", "Very High"])

print(data_bins)
3. Model Evaluation
Percentiles are used to evaluate error distributions and assess model reliability.
Practice Exercises
Exercise 1: Calculate Percentiles
For the dataset [5, 7, 8, 10, 12, 15, 20], manually calculate the 25th, 50th, and 75th percentiles.
Exercise 2: Outlier Detection
Identify outliers in the dataset [10, 15, 20, 25, 100, 120] using the 5th and 95th percentiles.
Exercise 3: Percentile Binning
Divide the dataset [1, 2, 3, 4, 5, 6, 7, 8, 9, 10] into four bins based on percentiles.
Limitations of Percentiles
- Non-Smooth Changes: Percentiles may not capture gradual changes in data distribution.
- Ineffective for Small Datasets: Requires sufficient data points for meaningful results.
Why Learn with The Coding College?
At The Coding College, we ensure that complex topics like Percentiles are simplified for beginners and professionals alike. With real-world examples and practical exercises, you’ll master these concepts with ease.
Conclusion
Understanding Percentiles is a cornerstone of data analysis and preprocessing in Machine Learning. By mastering this concept, you can effectively summarize data, detect outliers, and improve model performance.