
Welcome to The Coding College! While Linear Regression is great for modeling simple linear relationships, real-world data often requires a more flexible approach. This is where Polynomial Regression shines.
In this guide, you’ll learn what Polynomial Regression is, why it’s essential, and how to implement it in Python.
What Is Polynomial Regression?
Polynomial Regression is an extension of Linear Regression that models the relationship between the independent variable (xx) and the dependent variable (yy) as an nn-degree polynomial.
The equation for Polynomial Regression is:
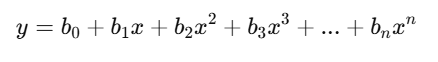
Where:
- n: Degree of the polynomial.
- b0,b1,b2,…: Coefficients determined during model training.
When to Use Polynomial Regression
- When the data exhibits non-linear trends.
- When a linear model underfits the data.
Why Is Polynomial Regression Important?
- Captures Complexity: Models complex, non-linear relationships.
- Flexibility: Adjust the degree of the polynomial to better fit the data.
- Wide Applications: Used in fields like physics, economics, and biology.
Visualizing Polynomial Regression
Example Dataset
Imagine predicting a car’s fuel efficiency (yy) based on engine size (xx):
| Engine Size (L) | Fuel Efficiency (MPG) |
|---|---|
| 1.0 | 50 |
| 1.5 | 45 |
| 2.0 | 35 |
| 2.5 | 25 |
| 3.0 | 20 |
Scatter Plot with Polynomial Regression Line
import numpy as np
import matplotlib.pyplot as plt
from sklearn.preprocessing import PolynomialFeatures
from sklearn.linear_model import LinearRegression

# Sample data
x = np.array([1.0, 1.5, 2.0, 2.5, 3.0]).reshape(-1, 1)
y = np.array([50, 45, 35, 25, 20])

# Transform data to include polynomial features
poly = PolynomialFeatures(degree=2)
x_poly = poly.fit_transform(x)

# Fit the model
model = LinearRegression()
model.fit(x_poly, y)

# Predict values
y_pred = model.predict(x_poly)

# Plot data and regression line
plt.scatter(x, y, color='blue', label='Data Points')
plt.plot(x, y_pred, color='red', label='Polynomial Regression Line')
plt.title("Polynomial Regression Example")
plt.xlabel("Engine Size (L)")
plt.ylabel("Fuel Efficiency (MPG)")
plt.legend()
plt.show()
Implementing Polynomial Regression in Python
1. Using Scikit-Learn
from sklearn.datasets import make_regression
from sklearn.preprocessing import PolynomialFeatures
from sklearn.linear_model import LinearRegression
from sklearn.model_selection import train_test_split
from sklearn.metrics import mean_squared_error

# Generate synthetic dataset
X, y = make_regression(n_samples=100, n_features=1, noise=15, random_state=42)

# Add polynomial features
poly = PolynomialFeatures(degree=3)
X_poly = poly.fit_transform(X)

# Split data into training and testing sets
X_train, X_test, y_train, y_test = train_test_split(X_poly, y, test_size=0.2, random_state=42)

# Train Polynomial Regression model
model = LinearRegression()
model.fit(X_train, y_train)

# Make predictions
y_pred = model.predict(X_test)

# Evaluate model
mse = mean_squared_error(y_test, y_pred)
print(f"Mean Squared Error: {mse}")
2. Comparing Linear and Polynomial Regression
# Linear Regression
linear_model = LinearRegression()
linear_model.fit(X, y)
y_linear_pred = linear_model.predict(X)

# Polynomial Regression
degree = 3
poly = PolynomialFeatures(degree=degree)
X_poly = poly.fit_transform(X)
poly_model = LinearRegression()
poly_model.fit(X_poly, y)
y_poly_pred = poly_model.predict(X_poly)

# Plot comparison
plt.scatter(X, y, color='blue', label='Data Points')
plt.plot(X, y_linear_pred, color='green', label='Linear Regression Line')
plt.plot(X, y_poly_pred, color='red', label=f'Polynomial Regression Line (Degree {degree})')
plt.title("Linear vs Polynomial Regression")
plt.legend()
plt.show()
Use Cases of Polynomial Regression
1. Predictive Analytics
Predicting trends like housing prices, sales growth, or population changes.
2. Scientific Research
Modeling non-linear relationships in physics, chemistry, and biology experiments.
3. Optimization Problems
Analyzing curves in engineering, logistics, or production.
Exercises
Exercise 1: Fit a Polynomial Model
Given data points x=[1,2,3,4,5]x = [1, 2, 3, 4, 5] and y=[1,4,9,16,25]y = [1, 4, 9, 16, 25], fit a Polynomial Regression model with degree 2 and plot the results.
Exercise 2: Compare Models
Train both a Linear and Polynomial Regression model on a dataset of your choice. Compare their Mean Squared Error (MSE).
Exercise 3: Degree Tuning
Using Scikit-Learn, experiment with different polynomial degrees on a dataset and identify the degree that minimizes error.
Why Learn Polynomial Regression with The Coding College?
At The Coding College, we make complex concepts like Polynomial Regression easy to understand with practical examples and exercises. Whether you’re starting with ML or enhancing your skills, our tutorials are designed to set you up for success.
Conclusion
Polynomial Regression is a powerful tool for modeling non-linear data. By understanding how to apply it effectively, you can tackle a wide range of real-world problems in Machine Learning.