
Welcome to The Coding College, where we simplify complex topics for coding enthusiasts! In this article, we’ll explore the Multinomial Distribution, its properties, and how to implement it in Python using NumPy.
What is the Multinomial Distribution?
The Multinomial Distribution is a generalization of the Binomial Distribution. It describes the probabilities of obtaining a specific combination of outcomes when repeating an experiment nn times, where each trial has multiple possible outcomes.
Key Characteristics:
- The experiment consists of nn independent trials.
- Each trial results in one of kk possible outcomes.
- The probabilities of the kk outcomes remain constant across all trials.
Multinomial Distribution Formula
The probability mass function (PMF) of the multinomial distribution is given by:
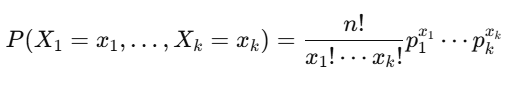
Where:
- nn=: Total number of trials.
- kk=: Number of possible outcomes.
- xi: Number of times outcome ii occurs (i=1,…,k).
- pi: Probability of outcome ii in a single trial (i=1,…,k).
Properties:
- ∑i=1kxi=n (The sum of outcomes equals the total trials).
- ∑i=1kpi=1 (The sum of probabilities is 1).
Real-Life Applications
- Survey Analysis: Modeling responses in a multiple-choice survey.
- Dice Rolls: Predicting the frequency of outcomes when rolling a die multiple times.
- Elections: Modeling vote distributions across multiple candidates.
- Natural Language Processing: Word distribution in a document.
Multinomial Distribution in NumPy
Python’s NumPy provides a function to generate samples from a multinomial distribution:
Syntax:
numpy.random.multinomial(n, pvals, size=None)n: Number of trials.pvals: Probabilities of outcomes (must sum to 1).size: Number of experiments to simulate.
Example 1: Simulating Multinomial Distribution
Scenario: Rolling a die 10 times
import numpy as np

# Number of trials
n = 10

# Probabilities of outcomes (fair die)
pvals = [1/6] * 6

# Generate outcomes
outcomes = np.random.multinomial(n, pvals, size=1)
print("Outcomes from rolling a die 10 times:", outcomes)
Output (Example):
[[1 2 3 1 2 1]]Explanation: The result represents the number of times each face (1–6) appeared.
Example 2: Visualizing Multinomial Distribution
Scenario: Rolling a die 1000 times
import numpy as np
import matplotlib.pyplot as plt

# Number of trials
n = 1000

# Probabilities of outcomes (fair die)
pvals = [1/6] * 6

# Generate outcomes
outcomes = np.random.multinomial(n, pvals, size=1)[0]

# Plot bar chart
faces = ['1', '2', '3', '4', '5', '6']
plt.bar(faces, outcomes, color='skyblue', edgecolor='black')
plt.title('Multinomial Distribution (Rolling a Die 1000 Times)')
plt.xlabel('Die Face')
plt.ylabel('Frequency')
plt.show()
Example 3: Simulating a Survey
Scenario: Polling 500 people about their favorite programming language
import numpy as np

# Number of respondents
n = 500

# Probabilities of choosing each language
pvals = [0.4, 0.3, 0.2, 0.1]  # Python, Java, C++, Others

# Simulate survey results
survey_results = np.random.multinomial(n, pvals, size=1)[0]

# Print results
languages = ['Python', 'Java', 'C++', 'Others']
for lang, count in zip(languages, survey_results):
    print(f"{lang}: {count}")
Output (Example):
Python: 198
Java: 152
C++: 103
Others: 47
Example 4: Repeating Experiments
Scenario: Simulating 5 surveys
import numpy as np

# Number of respondents
n = 500

# Probabilities of choosing each language
pvals = [0.4, 0.3, 0.2, 0.1]

# Simulate 5 surveys
survey_results = np.random.multinomial(n, pvals, size=5)

print("Results of 5 surveys:")
print(survey_results)
Output (Example):
[[201 150 99 50]
 [198 152 103 47]
 [205 145 120 30]
 [190 160 110 40]
 [202 148 100 50]]
Multinomial vs Binomial Distribution
| Aspect | Multinomial | Binomial |
|---|---|---|
| Number of Outcomes | kk-outcome experiments | Two outcomes (success or failure) |
| Trials | Independent trials (nn) | Independent trials (nn) |
| Applications | Multiple-choice, dice rolls | Coin flips, pass/fail experiments |
Applications of Multinomial Distribution
- Predictive Modeling: Classifying items into multiple categories.
- Gaming: Simulating outcomes in games with multiple choices.
- Marketing: Modeling customer preferences in product surveys.
Summary
The Multinomial Distribution is a powerful statistical tool for modeling scenarios with multiple possible outcomes. With Python’s NumPy, you can easily simulate and analyze real-world experiments like surveys, dice rolls, and customer preferences.
To learn more about Python, data science, and coding, visit The Coding College.