
Welcome to The Coding College, your trusted resource for learning coding and data science concepts! In this article, we’ll explore the Poisson Distribution, its significance in probability theory, and how to work with it using Python’s NumPy library.
What is a Poisson Distribution?
The Poisson Distribution is a discrete probability distribution that represents the probability of a given number of events occurring in a fixed interval of time or space, provided the events occur independently and at a constant average rate.
Key Characteristics:
- The events are independent of each other.
- The average rate (mean) of occurrence, denoted by λ\lambda (lambda), is constant.
- Two events cannot occur at exactly the same instant.
Real-Life Examples of Poisson Distribution
- Number of customer arrivals at a store in an hour.
- Number of emails received in a day.
- Number of calls at a call center per minute.
- Number of typos in a document.
Formula for Poisson Probability
The probability of observing kk events in an interval is given by:
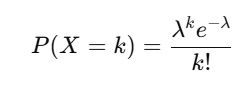
Where:
- k: Number of events.
- λ\lambda: Average number of events per interval.
- e: Euler’s number (≈2.718\approx 2.718).
Generating Poisson Distribution in NumPy
Python’s NumPy library provides a function to generate random numbers following a Poisson distribution:
Syntax:
numpy.random.poisson(lam=1.0, size=None)lam: The expected number of events (mean or λ\lambda).size: Output shape (default isNone, which returns a single value).
Example 1: Generate Random Poisson Data
Generate 10 random values from a Poisson distribution with an average rate of 3 events per interval:
import numpy as np

# Generate Poisson distribution data
data = np.random.poisson(lam=3, size=10)
print(data)
Output (Example):
[2 3 5 1 4 3 3 6 2 4]Example 2: Visualizing Poisson Distribution
import numpy as np
import matplotlib.pyplot as plt

# Parameters for the Poisson distribution
lam = 4  # Average rate (λ)
size = 1000  # Number of samples

# Generate Poisson data
data = np.random.poisson(lam=lam, size=size)

# Plot histogram
plt.hist(data, bins=range(0, max(data)+1), align='left', rwidth=0.8, color='skyblue')
plt.title('Poisson Distribution (λ=4)')
plt.xlabel('Number of Events')
plt.ylabel('Frequency')
plt.show()
Example 3: Simulating Real-World Scenarios
Scenario: Modeling Customer Arrivals
A store receives an average of 5 customers per hour. Simulate the number of customers arriving in 10 different hours:
customers = np.random.poisson(lam=5, size=10)
print(customers)
Comparing Poisson and Binomial Distributions
The Poisson Distribution is often used as an approximation of the Binomial Distribution when:
- The number of trials (nn) is large.
- The probability of success (pp) is small.
- The product n⋅pn \cdot p (mean of the binomial distribution) is constant and equal to λ\lambda.
Example: Poisson as an Approximation of Binomial
import seaborn as sns

# Parameters
n = 1000  # Number of trials
p = 0.01  # Probability of success
lam = n * p  # Poisson λ

# Generate data
binomial_data = np.random.binomial(n=n, p=p, size=1000)
poisson_data = np.random.poisson(lam=lam, size=1000)

# Plot both distributions
sns.histplot(binomial_data, kde=False, color='blue', label='Binomial', bins=30)
sns.histplot(poisson_data, kde=False, color='orange', label='Poisson', bins=30)
plt.title('Comparison of Binomial and Poisson Distributions')
plt.xlabel('Number of Events')
plt.ylabel('Frequency')
plt.legend()
plt.show()
Applications of Poisson Distribution
- Queueing Theory: Analyze customer arrival patterns.
- Traffic Management: Model vehicle arrivals at a traffic signal.
- Healthcare: Estimate patient arrivals in an emergency room.
- Telecommunications: Model the frequency of dropped calls.
Summary
The Poisson Distribution is a vital tool in statistics, used to model random events over time or space. It is especially useful in real-world scenarios where occurrences are independent and consistent. With Python’s NumPy, you can easily generate and visualize Poisson-distributed data to better understand its properties.