
Welcome to The Coding College, where we make data science and programming concepts easy to understand! In this guide, we’ll explore the Rayleigh Distribution, its properties, real-world applications, and how to implement it in Python using NumPy.
What is the Rayleigh Distribution?
The Rayleigh Distribution is a continuous probability distribution commonly used in signal processing, wind speed modeling, and reliability engineering. It is a special case of the Weibull Distribution.
Probability Density Function (PDF):
The PDF of the Rayleigh Distribution is defined as:
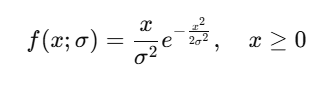
Where:
- x: Random variable.
- σ\sigma: Scale parameter (>0).
Key Characteristics
- Shape: Defined for x≥0x \geq 0; starts at 0 and rises to a peak before tapering off.
- Mean: σπ/2\sigma \sqrt{\pi/2}.
- Variance: 4−π2σ2\frac{4 – \pi}{2} \sigma^2.
Real-Life Applications
- Signal Processing: Modeling the magnitude of a random vector in two dimensions.
- Wind Speed Analysis: Predicting wind speeds in meteorology.
- Reliability Engineering: Analyzing the time to failure for mechanical systems.
Rayleigh Distribution in NumPy
Python’s NumPy library provides an easy way to generate random numbers from the Rayleigh Distribution:
Syntax:
numpy.random.rayleigh(scale=1.0, size=None)scale: The scale parameter (σ\sigma).size: Output shape (default isNone, which returns a single value).
Example 1: Generating Random Numbers
Scenario: Simulating random wind speeds
import numpy as np

# Generate Rayleigh random numbers
data = np.random.rayleigh(scale=2.0, size=10)
print("Random samples from Rayleigh Distribution:", data)
Output (Example):
[1.92 2.67 0.92 1.85 3.48 2.11 1.49 3.08 2.57 0.78]Example 2: Visualizing the Rayleigh Distribution
import numpy as np
import matplotlib.pyplot as plt

# Generate data
data = np.random.rayleigh(scale=2.0, size=1000)

# Plot histogram
plt.hist(data, bins=30, color='lightblue', edgecolor='black', density=True)
plt.title('Rayleigh Distribution (scale=2)')
plt.xlabel('Value')
plt.ylabel('Density')
plt.grid(True)
plt.show()
Example 3: Comparing Rayleigh Distributions
Scenario: Analyze the effect of the scale parameter
import numpy as np
import matplotlib.pyplot as plt

# Generate data with different scale parameters
data1 = np.random.rayleigh(scale=1.0, size=1000)
data2 = np.random.rayleigh(scale=2.0, size=1000)
data3 = np.random.rayleigh(scale=3.0, size=1000)

# Plot histograms
plt.hist(data1, bins=30, alpha=0.5, label='scale=1.0', density=True, color='blue')
plt.hist(data2, bins=30, alpha=0.5, label='scale=2.0', density=True, color='orange')
plt.hist(data3, bins=30, alpha=0.5, label='scale=3.0', density=True, color='green')

plt.title('Rayleigh Distributions with Different Scale Parameters')
plt.xlabel('Value')
plt.ylabel('Density')
plt.legend()
plt.grid(True)
plt.show()
Example 4: Application in Signal Processing
Scenario: Modeling signal magnitudes
import numpy as np
import matplotlib.pyplot as plt

# Generate random magnitudes of signals
scale = 1.0
magnitudes = np.random.rayleigh(scale=scale, size=1000)

# Visualize the signal magnitudes
plt.hist(magnitudes, bins=30, color='purple', edgecolor='black', density=True)
plt.title('Signal Magnitudes Modeled by Rayleigh Distribution')
plt.xlabel('Magnitude')
plt.ylabel('Density')
plt.grid(True)
plt.show()

# Print statistics
print("Mean of signal magnitudes:", np.mean(magnitudes))
Properties of Rayleigh Distribution
| Property | Description |
|---|---|
| Scale Parameter (σ\sigma) | Determines the spread of the distribution. |
| Mean | σπ/2\sigma \sqrt{\pi/2}. |
| Variance | 4−π2σ2\frac{4 – \pi}{2} \sigma^2. |
| Applications | Signal processing, reliability analysis, and meteorology. |
Rayleigh vs Other Distributions
| Aspect | Rayleigh | Normal | Exponential |
|---|---|---|---|
| Type | Continuous | Continuous | Continuous |
| Focus | Magnitudes of random vectors | General symmetric data | Time between events |
| Applications | Signal processing | Data analysis | Queueing models |
Summary
The Rayleigh Distribution is a vital statistical tool for modeling magnitudes and analyzing failure times in various fields. Python’s NumPy library simplifies generating and visualizing Rayleigh-distributed data, enabling you to analyze real-world phenomena effectively.
For more tutorials on Python, statistics, and data science, visit The Coding College.